Table of Contents
ToggleFirst Pass Claim Rate: Formula, Benchmarks, and Improvement Steps
First pass claim rate shows how many claims move through the first submission without an avoidable rejection or correction. It gives billing leaders a quick view of claim quality before repeated work begins. A strong rate often means cleaner data, clearer coding, and better checks at the start.
The number looks simple, but teams often define it in different ways. Some count claims accepted into the payer system. Others count claims paid or assigned to patient responsibility without another submission. A useful report must state which event counts as a successful first pass.
This guide explains the formula, a worked example, practical benchmarks, common causes of failure, and clear improvement steps. It also shows where automation can support people without hiding problems or replacing expert review.
Measure the first submission. Fix the root cause. Improve every claim.
What Is First Pass Claim Rate?
First pass claim rate is the percentage of claims that meet your chosen success rule on their first submission. For an acceptance measure, success means the clearinghouse and payer accept the original claim for processing without sending it back for correction.
Acceptance does not mean payment. A payer may accept a technically valid claim and later deny it during review. If your organization wants to measure payment on the first submission, name that metric first pass resolution and define the final outcomes that count.
Write the definition beside every dashboard. State the claim types, payers, date range, and events included. This small step prevents leaders from comparing two numbers that look alike but answer different questions.
Why First Pass Claim Rate Matters

A high first pass claim rate reduces touches, delays, and repeated data entry. Staff spend less time correcting basic issues and more time handling claims that need real judgment. The billing team can also submit work faster because fewer claims return to the queue.
Better first pass quality supports cash flow. Accepted claims enter payer review sooner, while corrected claims restart part of the process. Even a short delay can grow across thousands of claims and make accounts receivable harder to manage.
The metric also points to upstream problems. A fall in performance may reveal weak registration, old insurance data, missing authorization, coding gaps, or a payer rule change. Leaders can use the result as an early warning, then study the details behind it.
First Pass Claim Rate Formula
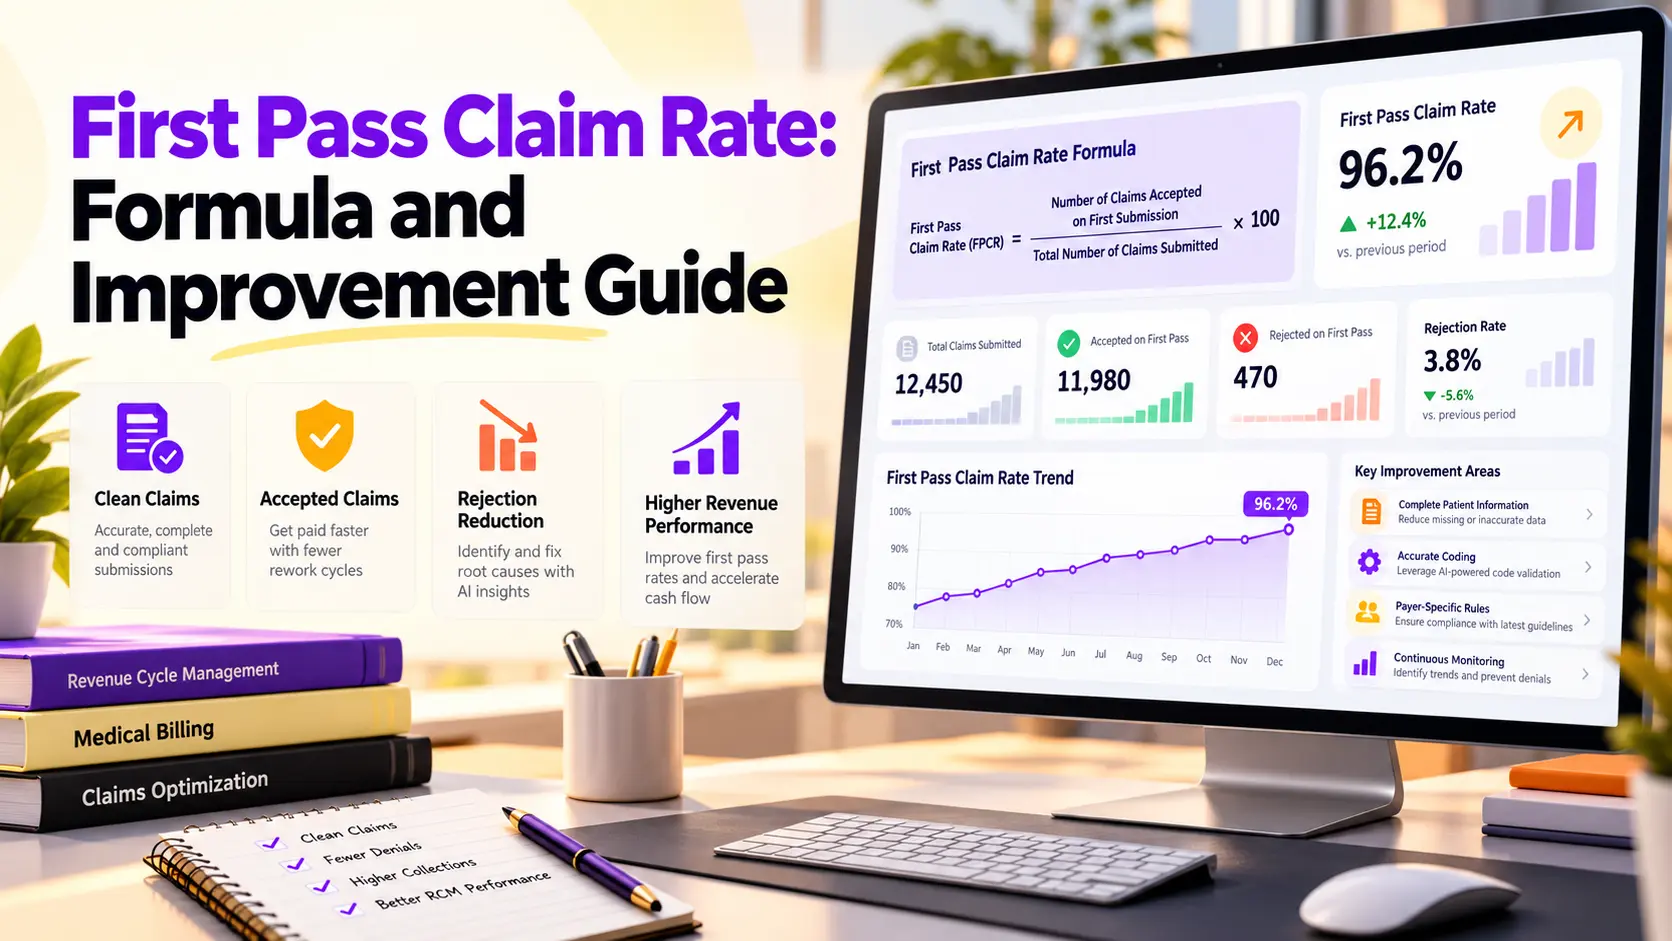
For an acceptance measure, use this formula: claims accepted on the first submission divided by total claims submitted, multiplied by 100. The numerator and denominator must cover the same period and the same group of claims.
Decide whether the denominator includes primary claims only or also includes secondary claims. Set rules for voids, test claims, corrected claims, encounters held outside the period, and claims sent more than once. Apply the same rules every month.
For a resolution measure, replace accepted claims with claims paid, transferred to patient responsibility, or otherwise closed after the original submission. Do not present this result as acceptance because it measures a later point in the revenue cycle.
A Simple Calculation Example
Imagine a practice submits 10,000 primary claims in one month. The payer accepts 9,400 of the original claims for processing. Divide 9,400 by 10,000, then multiply by 100. The result is 94 percent.
The remaining 600 claims need review. The team should not treat them as one problem. It should group them by cause, payer, location, provider, specialty, service, and claim type. That view turns a score into an action plan.
If the next month reaches 95 percent, the rate improved by one percentage point. It did not improve by one percent of the old rate. Using the right wording keeps reports clear for finance, operations, and clinical leaders.
First Pass Claim Rate vs Related Metrics
The clean claim rate often describes claims that pass required edits and enter payer processing without correction. However, vendors and organizations may use the phrase differently. Always read the definition before comparing a published result with your own dashboard.
The first pass acceptance rate focuses on entry into the payer system. First pass resolution focuses on a favorable final result without a new submission. Initial denial rate measures claims denied after adjudication, so it answers another question.
Track the measures together. Acceptance shows front end data and format quality. Resolution shows whether claims survive payer review. Denials show where coverage, coding, medical need, or payer decisions stop payment after acceptance.
What Is a Good First Pass Claim Rate Benchmark?
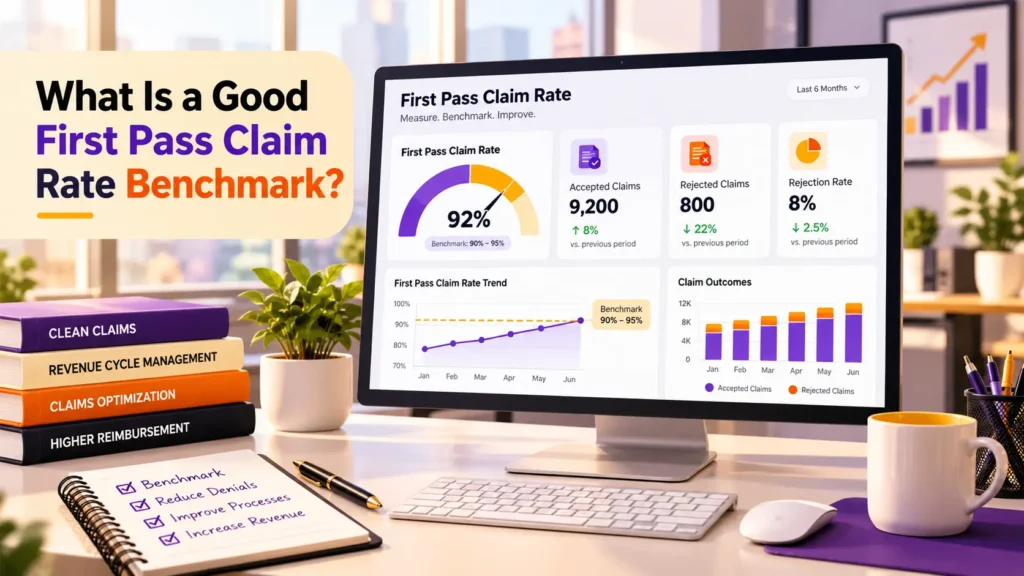
There is no single benchmark that fits every definition and every provider. For first submission acceptance, many organizations use 95 percent or higher as a practical internal goal. Strong systems may report results above 98 percent, but their rules and claim mix may differ.
For first pass resolution, a target near 90 percent or higher is commonly discussed because this measure is stricter. A claim can pass technical edits and still fail to resolve on the original submission. Never apply an acceptance target to a resolution report.
Use outside benchmarks as a reference, not a promise. Start with a verified baseline, compare similar specialties and payers, and set a target that improves performance without encouraging staff to hold difficult claims simply to protect the score.
Why Benchmarks Differ Between Organizations
Specialty changes the claim pattern. A primary care office, surgery group, imaging center, behavioral health practice, and hospital do not send the same services or face the same documentation and authorization needs. Their useful targets may differ.
Payer mix also matters. Each payer can use different edits, portals, enrollment rules, filing limits, and authorization steps. A practice with many plans and products may have more variation than a practice with a narrow network.
Definitions can create the largest difference. One report may count clearinghouse acceptance, another may count payer acceptance, and another may count payment. Before leaders compare results, they should match the success event, exclusions, time period, and claim population.
Eligibility and Coverage Errors
Inactive coverage, the wrong plan, a changed member number, or an incorrect subscriber relationship can stop a claim before review. Coordination of benefits errors can also send a claim to the wrong payer or place the payers in the wrong order.
Use automated insurance eligibility verification before the visit and again when needed before billing. Save the payer response, coverage dates, plan details, and benefit notes so staff can solve differences before submission.
Do not treat a successful eligibility response as a promise of payment. Eligibility confirms reported coverage at that time. The claim must still meet coding, authorization, medical need, documentation, and plan rules.
Patient and Provider Data Errors
Small registration errors can cause large billing delays. A misspelled name, wrong birth date, old address, missing group number, or swapped subscriber detail may prevent the payer from matching the claim to its member record.
Provider data needs the same care. Confirm the billing and rendering provider, National Provider Identifier, taxonomy, service location, payer enrollment, and place of service. A valid identifier may still fail when the provider is not enrolled for that plan or location.
Create one trusted source for patient, payer, provider, and location data. Limit free text where a set value works better. When staff correct a field, update the source record so the same error does not return on the next claim.
Coding and Modifier Errors
A claim may fail because a code is missing, invalid for the service date, or not supported by the note. Diagnosis pointers, modifiers, units, place of service, and procedure combinations can also trigger edits or later denials.
Use AI medical coding to compare the record with possible ICD, CPT, and HCPCS choices, then keep a trained person in the approval step. Automation can surface a gap, but the final code must match the provider record.
Maintain current payer and coding rules. Review edits for bundled services, unit limits, age or sex conflicts, and diagnosis relationships. When one rule creates many failures, fix the rule or workflow at its source instead of correcting each claim by hand.
Authorization and Referral Errors
Some services need prior authorization, a referral, or both. A claim can fail when the authorization is missing, expired, linked to another provider, or approved for different dates, units, or services.
Capture the authorization number and approved details in a structured field. Compare those details with the scheduled service and final claim. If care changes, staff should check whether the payer requires an update before billing.
Authorization does not guarantee payment, but a missing or mismatched approval creates avoidable risk. Connect scheduling, clinical documentation, and billing so the claim team does not discover the problem after the service.
Payer Rules and Documentation Gaps
Payer edits change over time. A payer may add a required field, change an attachment rule, update a policy, or enforce a filing limit differently. A sudden rise in failures for one payer often signals a rule or connection issue.
Documentation must support the service and the codes on the claim. Missing signatures, unclear orders, weak diagnosis detail, or absent procedure notes can lead to a denial even when the electronic claim format is correct.
Keep payer rules in a managed library and record the source and update date. Route uncertain cases to the right expert. This approach gives staff clear guidance while preventing old rules from spreading across new claims.
Clearinghouse Rejections and Claim Acknowledgments
Electronic claims produce acknowledgments before payment review. A 999 response reports whether the transaction file met required electronic standards. A 277CA response reports whether claims were accepted or rejected for payer processing.
Read these responses quickly and connect each result to the correct claim. A file level acceptance does not prove that every claim inside it passed. Teams need claim level status and clear ownership for every rejection.
A rejected claim never reached adjudication, so calling it a denial hides the real stage of failure. Separating rejections from denials helps the team send the problem to registration, coding, enrollment, technology, or payer follow up without delay.
How to Find the Real Root Causes
Start with reason codes and response text, then group failures into a small set of causes. Review volume and dollars together. A frequent low value problem may waste staff time, while a rare high value problem may create a major cash risk.
Study each cause by payer, provider, site, specialty, claim form, service, and user workflow. Track the claim rejection rate beside the success measure. The two should move in opposite directions when both use the same acceptance definition and population.
Improvement Step 1: Standardize Source Data
Standardize how staff enter patient, insurance, provider, service, and authorization data. Use required fields, clear names, controlled choices, and ownership rules. Train staff with real examples from your own failure data, then update the process when patterns change.
Improvement Step 2: Add Checks Before Submission
Add checks at the point where staff can still fix the source. Verify coverage before care, confirm authorization before the service, review documentation before coding, and validate the final claim before sending it. Early correction costs less than repeated billing work.
Improvement Step 3: Use Automation and Clear Work Queues
Use clean claim automation to check eligibility, demographics, codes, modifiers, units, payer edits, authorization, documentation, and claim format before submission. Send only real exceptions to people instead of making staff inspect every field.
Build work queues by cause and owner. Registration should receive patient data issues, coding should receive code questions, and payer teams should receive enrollment or policy problems. Add due dates so urgent claims do not wait behind easy work.
Automation should explain why it stopped a claim and show the source data used. Teams need a clear way to approve, correct, or challenge the result. That feedback should improve rules over time and prevent the same false alert from repeating.
How Xoodoc Can Improve First Pass Performance
Xoodoc can connect pre submission checks with healthcare revenue cycle automation. The workflow can identify missing details, apply payer aware rules, route exceptions, and retain evidence for human review.
A connected process also helps leaders see where errors begin. They can trace a rejection back to registration, eligibility, coding, authorization, documentation, or electronic claim setup instead of treating every returned claim as a billing team failure.
The goal is not a pretty dashboard. The goal is fewer avoidable touches, faster payer entry, and more reliable cash flow. Xoodoc supports that goal by checking claim quality early while keeping people in control of final decisions.
A Practical Measurement Plan
Choose one written definition and measure it monthly. Report total claim volume, accepted claims, excluded claims, and the reasons for every exclusion. Compare the overall rate with payer and specialty views, then assign the largest root causes to named owners. Review whether fixes lower rework as well as improve the score. Do not delay valid difficult claims to protect the metric. For official information about electronic Medicare claim submission, visit the CMS electronic health care claims resource.
Frequently Asked Questions
What is first pass claim rate?
It is the percentage of claims that meet a defined success rule on their first submission. Most acceptance reports count claims accepted for payer processing without correction.
How do you calculate first pass claim rate?
Divide claims accepted on the first submission by total claims submitted for the same period, then multiply the result by 100.
What is a good first pass claim rate?
For first submission acceptance, many organizations use 95 percent or higher as a practical goal. Compare only reports that use the same definition, exclusions, claim types, and time period.
Is first pass claim rate the same as clean claim rate?
Not always. Some organizations use the terms in the same way, while others define clean claims by internal edits and first pass claims by payer acceptance. Write the exact definition on the report.
What causes a low first pass claim rate?
Common causes include inactive coverage, wrong patient details, provider enrollment gaps, coding errors, missing modifiers, authorization problems, weak documentation, payer rule changes, and claim format errors.
How can AI improve first pass claim performance?
AI can check many claim fields, compare payer rules, find missing information, and route exceptions before submission. People should review uncertain cases and approve final billing decisions.